ASA Conference on Statistical Practice 2018, Friday 2 of 6, Streamlining Your Work Using (Shiny) Apps

Highlights from Conference on Statistical Practice.
Friday 2/16/2018
- 8:00 AM Keynote Address & 9:15 AM Working with Messy Data
- 11:00 AM Streamlining Your Work Using (Shiny) Apps
- 2:00 PM Data Mining Algorithms / Presenting and Storytelling
- 3:45 PM Working with Health Care Data
- Posters I Wish I’d Seen
- Additional Sessions I Wish I’d Attended
Saturday 2/17/2018
- 9:15 AM Poster Session 3 / Survival Analysis v. ‘Survival’ Analysis
- 11:00 AM Causal Inference
- 2:00 PM Deploying Quantitative Models as ‘Visuals’ in Popular Data Visualization Platforms
- Additional Sessions I Wish I’d Attended
11:00 AM Streamlining Your Work Using Apps
Mechanizing Clinical Review Processes with R Shiny for Efficiency and Standardization Jimmy Wong, Food and Drug Administration
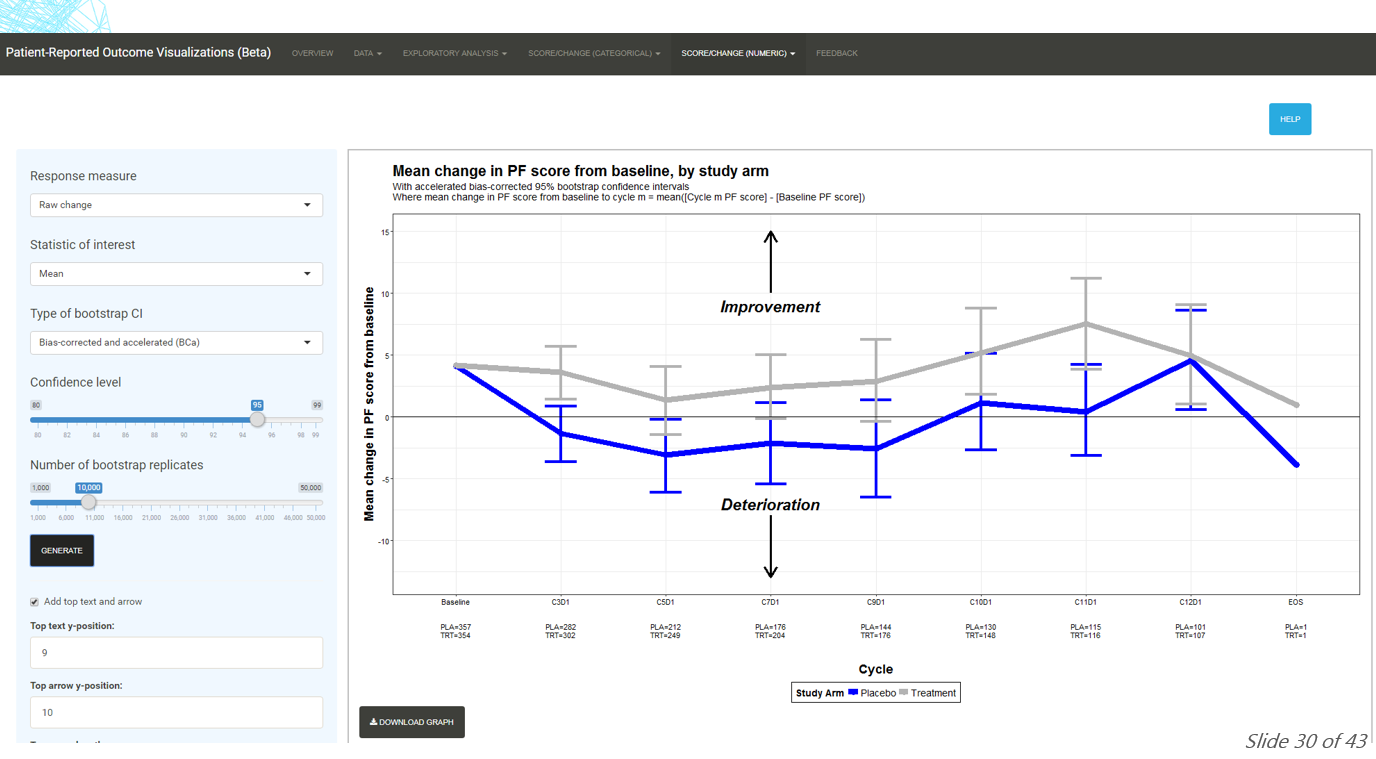
Problem: FDA statisticians build awesome graphics sometimes other statisticians would like to use, but there is no standardized language, so everything looks a little different.
Shiny is used here to create temporary tools quickly to solve problems efficiently. Shiny apps are for long, complex code, while docs are for a few visualizations or tables.

To communicate what is available, Wong started a Shiny wiki with what he has. I like this sense of using the following communication channels to develop a strong company work group. His team approached communication around the change on two levels: Orally and In Writing.
Orally
- Shiny users group
- FDA town halls
- FDA internal conferences
- External conferences (such as CSP)
In Writing
- Shiny wiki
- OB quarterly newsletters
- FDA daily announcements
- Code documentation
While nothing new, under the “Lessons Learned” slides, he mentioned “less is more,” and it struck me maybe that is true when dealing with new approaches to old problems. Present less. I think there’s risk the quality of analysis will be underestimated, though. But the idea is to avoid intimidating jargon and get people interested.
Building Shiny Apps: With Great Power Comes Great Responsibility Jessica Minnier, Oregon Health & Science University
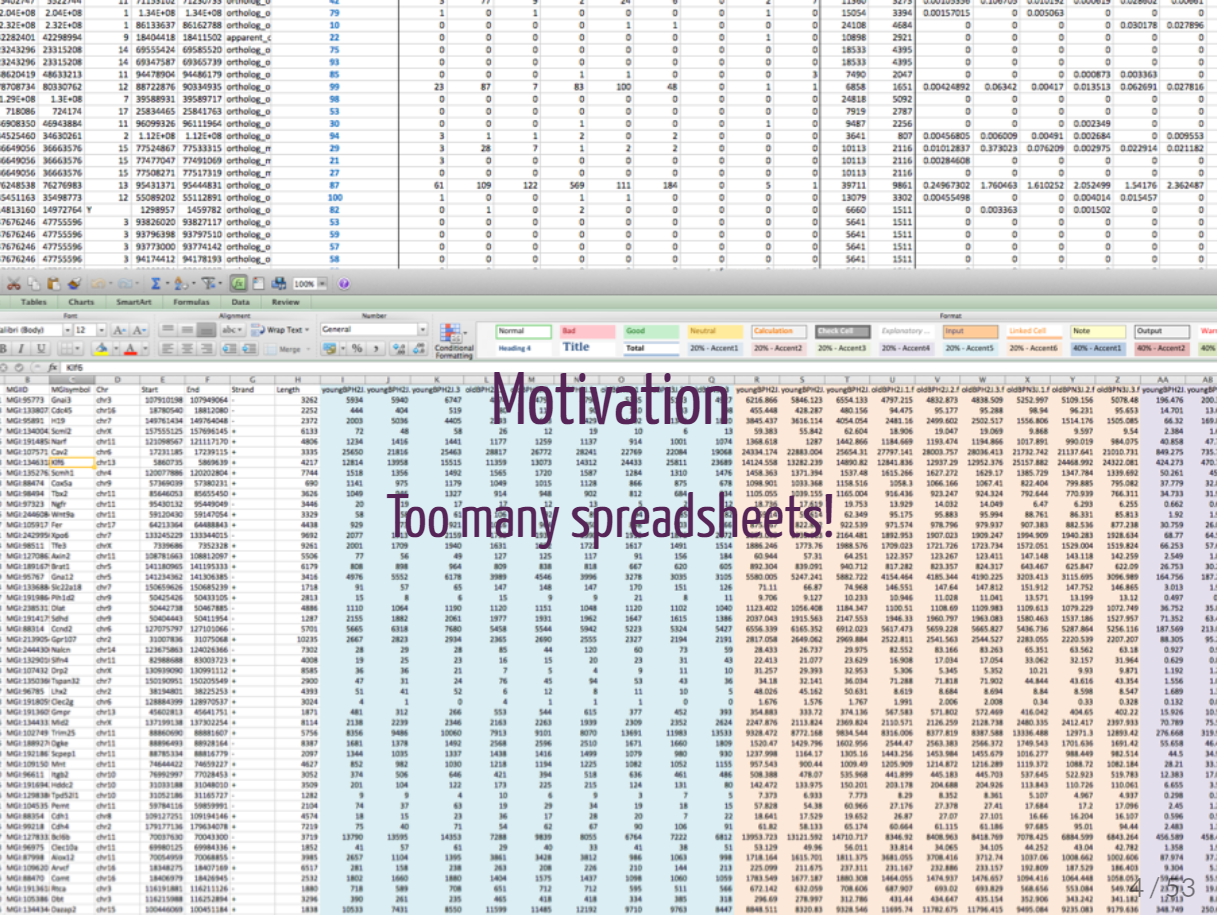
Problem: Experts at their field may not be experts at summarizing their data in meaningful ways, but they want to share their results in an easily digestible way.
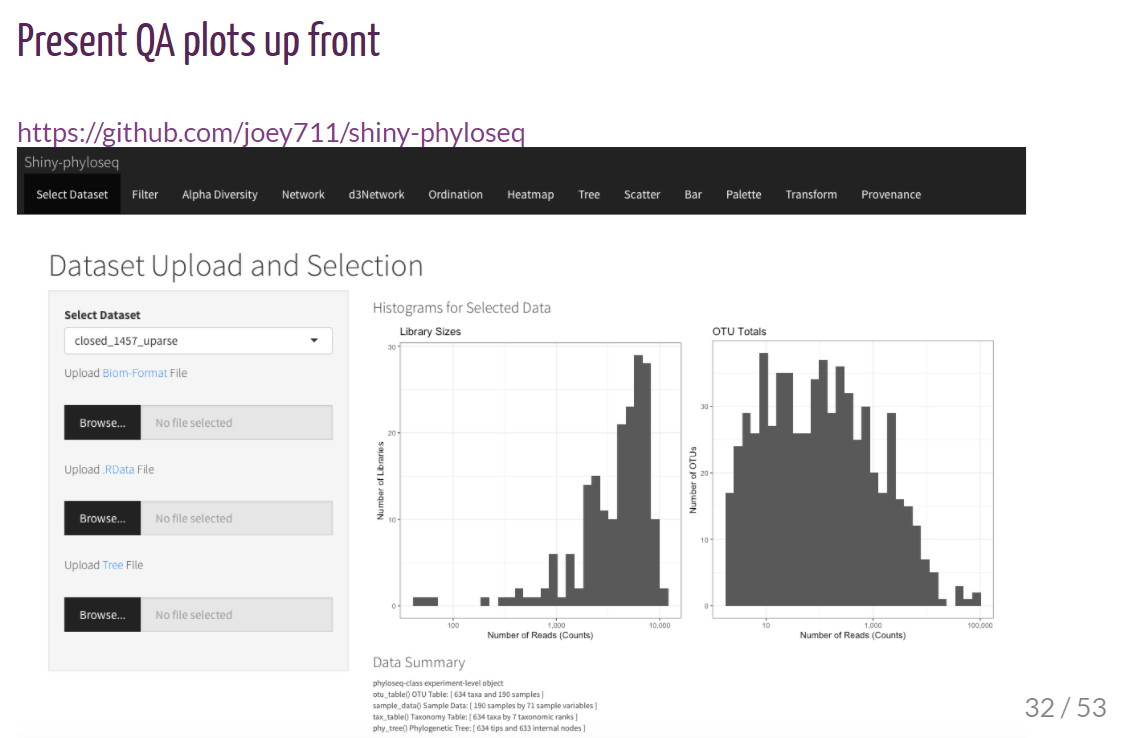
Shiny apps are exciting because they really empower people to look at their data: for example, a data journalism app to look at analysis. Shiny apps can help introduce people to a new R-package. They can also be used to QA data:

Hover-over is popular. The dropdown box allows you to choose which field is which for imported data. Build errors to make it clear when the app user is not following instructions. Make pictures on how the data the user is importing needs to be structured. Adding a Shiny landing page is key and shinyLP can help. Instructions are important and a good example would be ClustViz’s documentation, which Minnier said “obviously took a long time.”
browser(), print() everything to debug R code. She recommends testthat and shinytest for unit testing. For speed: Rprofiler in Rstudio is most useful, and for asynch programming, future and promises can help.
Her slides had a lot of detail. Slides and code are available.
Up next: 2:00 PM Data Mining Algorithms / Presenting and Storytelling