Mining Sent Email for Self-Knowledge

How can we use data analytics to increase our self-knowledge? Along with biofeedback from digital devices like FitBit, less structured sources such as sent emails can provide insights.

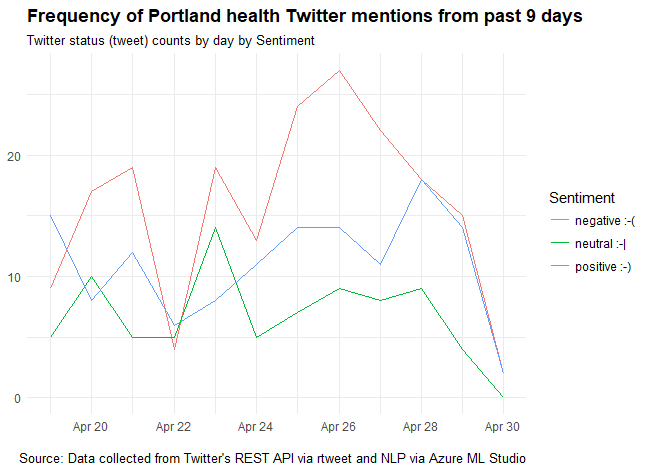
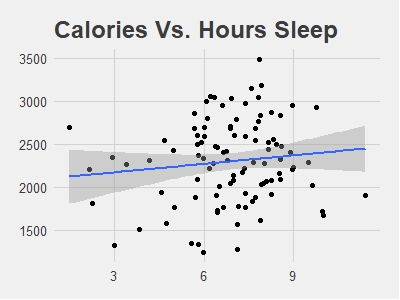
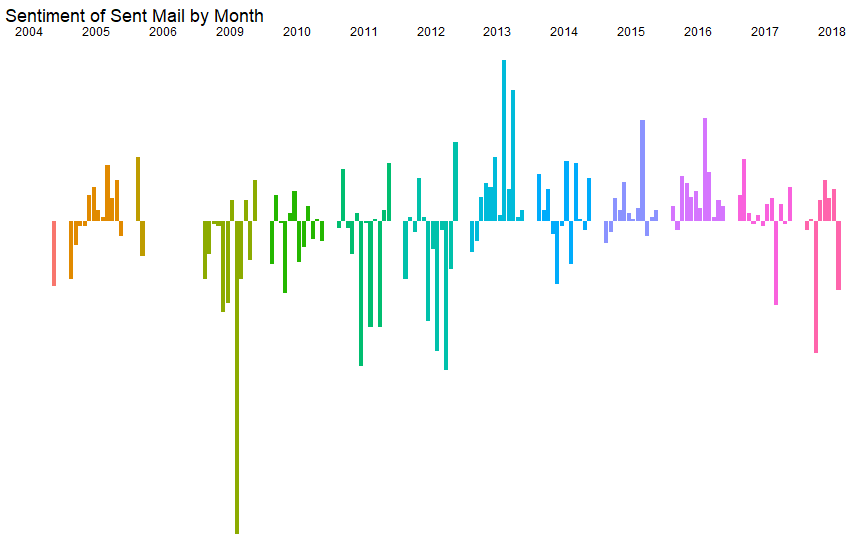
E.g. here it seems my communication took a sudden more positive turn in 2013. Let’s see what else shakes out of my sent email corpus.

monthly_sentiment

Read More

ImageNet needs more Wild Boar Photos

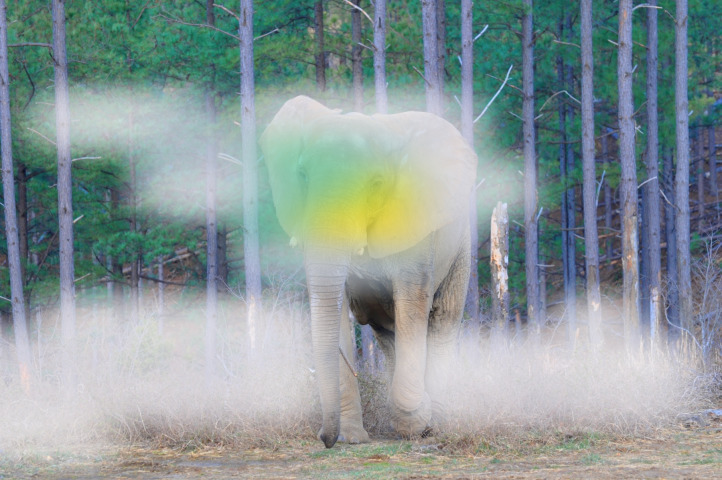
Is your deep convolutional network misclassifying images? You can find out why with a heatmap of class activation overlaid on its misclassified pictures.

A heatmap overlay shows parts of an image most activated in a neural network’s last convolutional layer. In this African elephant picture, the top-most convolutional layer of the VGG16 architecture turns the photo into a 14x14 grid highlighting blocks with strongest African_elephant activation:

af_el_1

Read More

Ghosts of Animals Haunt Portland's Overpriced Apartments

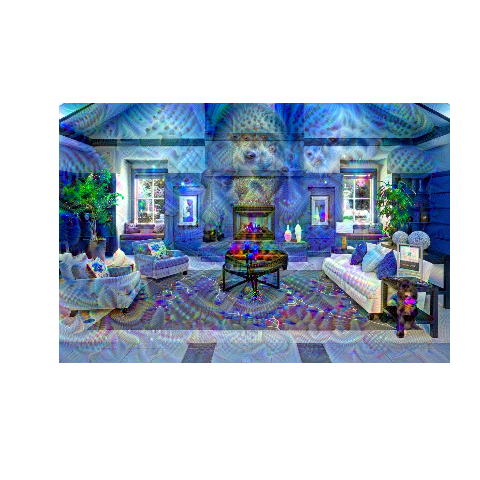
Apartment hunting in an expensive city is leading me to curses and exclamations. Following are some outstanding examples of insanely priced apartments in Portland, OR, run through Google Deep Dream in hopes of my understanding why people pay so much for a small box. These listings will be gone in no time (I’m sure) so including some captions for posterity.

Let’s start with this one. Indeed, it appears $1899 for 1 bedroom grants access to this clubhouse haunted by some floating apparition:

clubhousedd

Read More

Clustering NHL Goalies

This has been a great Stanley Cup playoffs for Washington Capitals fans such as myself. With so much breath holding, I’ve paid more attention this year than recent years. As a former goalie myself, my curiosity grew towards: Who are these goalies so much better than me they beat me to being in the NHL? Who’s a hero, and who’s maybe not a keeper?

What better way to understand how they shake out than clustering their regular season statistics? This is an opportunity to work with tibbleColumns by Hoyt Emerson, a new package that adds some intriguing functionality to dplyr, and dendextend by Tal Galili, which adds options to hierarchical clustering diagrams. Best data found came from Rob Vollman at http://www.hockeyabstract.com/testimonials.

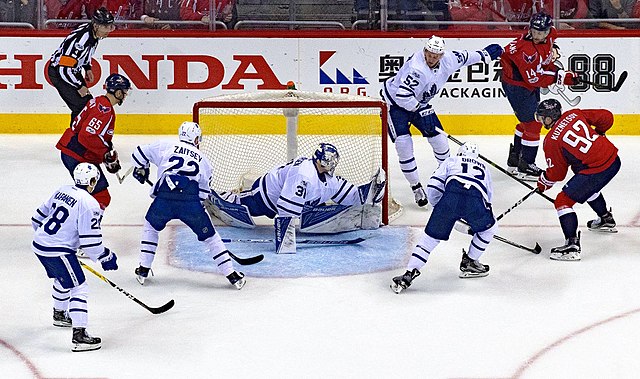
Bottom line up front: unsupervised learning here taught more about my data set, and less about the world it represents. Where it did teach about the world of NHL goalies, it showed this guy, is standing out:

Frederick Andersen

Read More

Best city for data scientists today according to two variables harvested with rvest

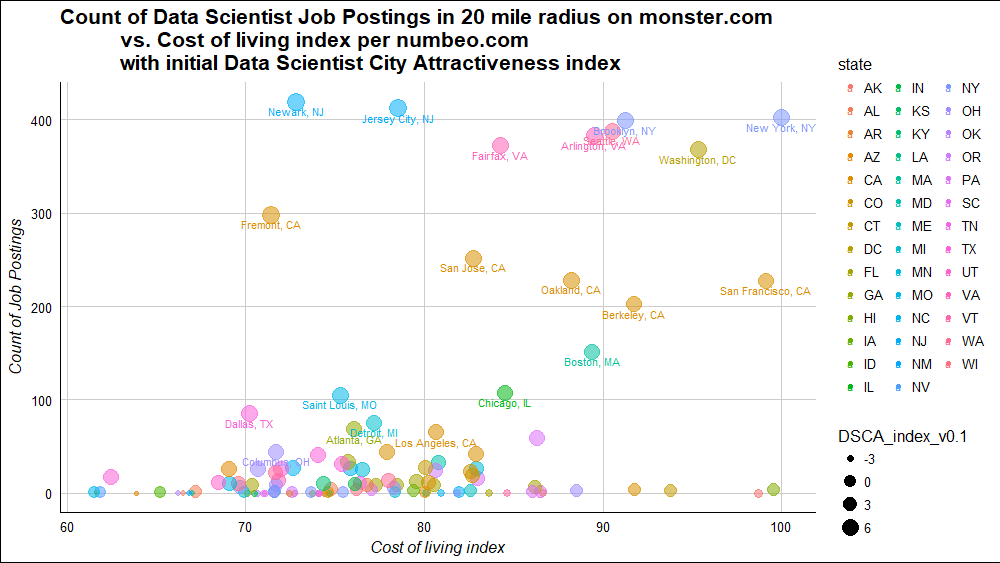
Jobs vs. Cost of Living by City

Some cities are more appealing for a data scientist to live than others. Several websites list best cities for data scientists, but their lists don’t agree and their methods are not explained, so the quality of the analysis and ability to determine which individuals their results can be inferred to are limited.

So here I set up to develop a reproducible, if not quite complete, measure of data scientist city attractiveness. Number of jobs for data scientists and cost of living may be two important variables. Using R’s rvest package, we can scrape from the web necessary information to get an idea how cities look in terms of these two. Got to DSCA index v0.1 shown above with top 21 cities labeled.

Bottom Line Up Front: Eight large hiring metros stand out, and less expensive cities within their communing distance look best by these variables. In particular, Newark, NJ, as cheap and close to lots of data scientist jobs, has the highest value in DSCA index v0.1. These two variables alone and the sources I chose show some interesting initial results, but they don’t seem to capture a complete picture, so more work is needed before getting a reliable reproducible index.
Read More

Hello World! Here's a Normal Distribution!

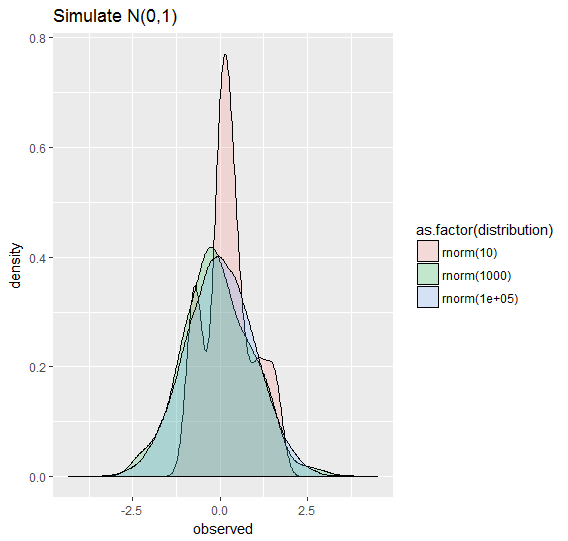
This code simulates Normal(0,1), and this visualization shows smaller samples can vary much more than large samples from the true distribution. Maybe it’s not a fascinating picture although there is a deep mystery or two in there. Can we know the truth? Isn’t everything we know based on a sample? Is everything we believe, like these three rnorm(), an incomplete story?

random simulations output

Read More