ASA Conference on Statistical Practice 2018, Friday 3 of 6, Data Mining Algorithms & Presenting and Storytelling

Highlights from Conference on Statistical Practice.
Friday 2/16/2018
- 8:00 AM Keynote Address & 9:15 AM Working with Messy Data
- 11:00 AM Streamlining Your Work Using (Shiny) Apps
- 2:00 PM Data Mining Algorithms / Presenting and Storytelling
- 3:45 PM Working with Health Care Data
- Posters I Wish I’d Seen
- Additional Sessions I Wish I’d Attended
Saturday 2/17/2018
- 9:15 AM Poster Session 3 / Survival Analysis v. ‘Survival’ Analysis
- 11:00 AM Causal Inference
- 2:00 PM Deploying Quantitative Models as ‘Visuals’ in Popular Data Visualization Platforms
- Additional Sessions I Wish I’d Attended
2:00 PM Data Mining Algorithms / Presenting and Storytelling
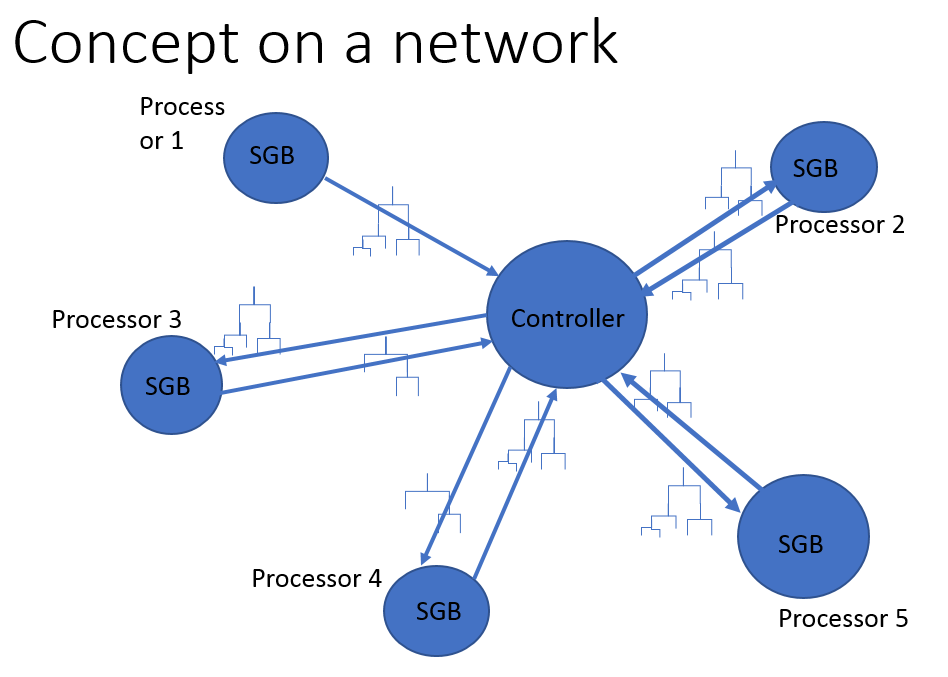
Stochastic Gradient Boosting on Distributed Data Roxy Cramer, Rogue Wave Software
Problem: Iterative algorithms like Gradient Boosting Trees and Generalized Regression can’t be run on distributed computing efficiently.
Cramer does solve some of this problem by an approximate method. This method is useful to see if gradient boosted trees are worth pursuing for a modelling question before spending computing power to fully train a model. Her algorithm performed well on the UCI Mushroom dataset that has two classes, edible or poisonous, but not well on the UCI Covertype dataset that has multiple classes. She also thinks the algorithm has some advantage when there is more predictability in the data.

I think distributed SGB is an implementation of MapReduce on an algorithm not designed to do that, and the results are OK, but not groundbreaking. It looks like the algorithm would only be useful as is now for an initial check if SGB, logistic regression, or another iterative algorithm works on some large data set at all. Once the answer looks like “yes” then the algorithm will have to be run normally, one one lonely, hard-working processor.
Telling the Story of Your Stats Jennifer H. Van Mullekom, Virginia Tech
Problem: Presentations on stats and numbers can be boring.
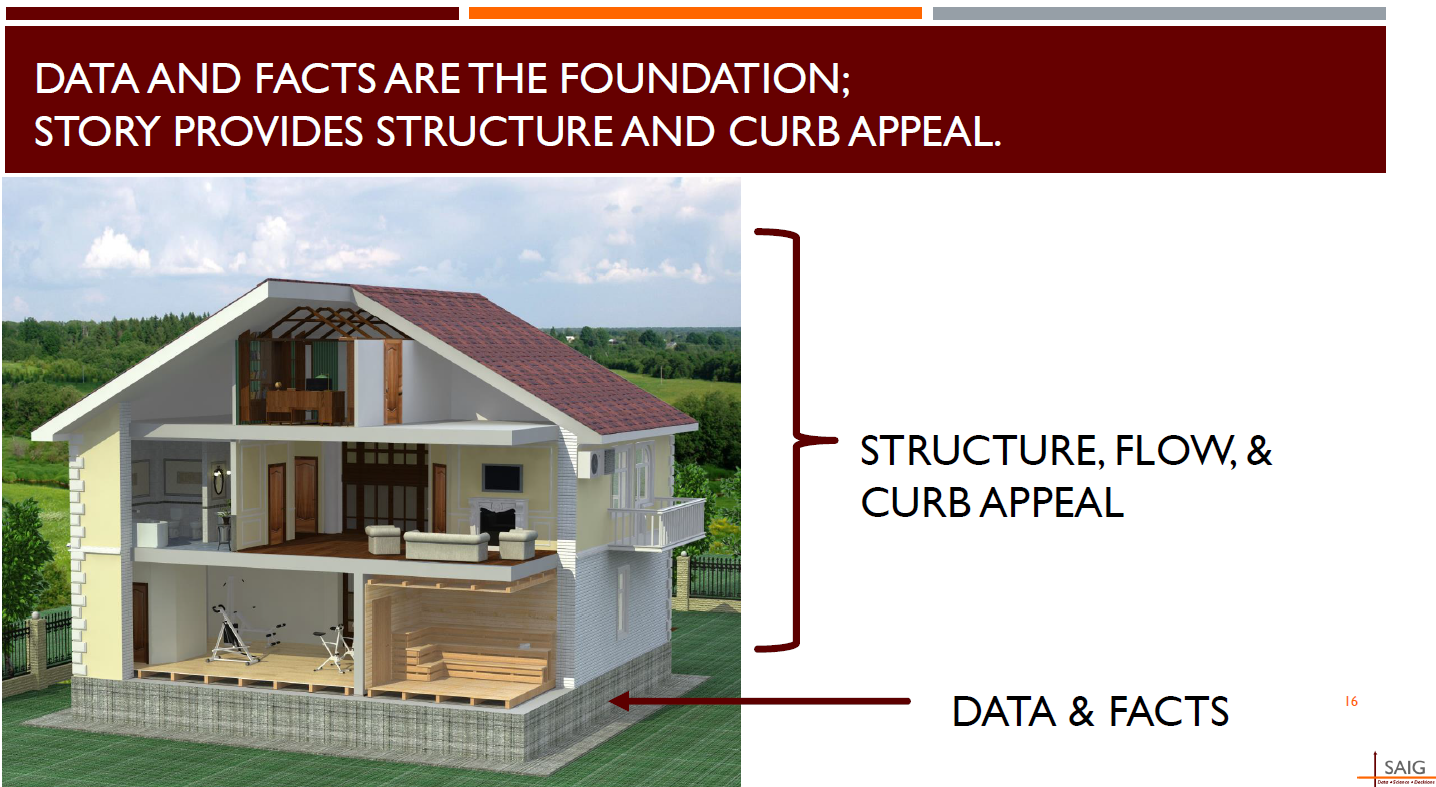
If your presentation is boring, people won’t pay attention to it. That kind of needs to be said. If your presentation is interesting, it’ll drill itself into your audience’s long-term memory. In language from Thinking Fast and Slow, stories engage quick-thinking system 1, while science and facts engage slow-thinking system 2.
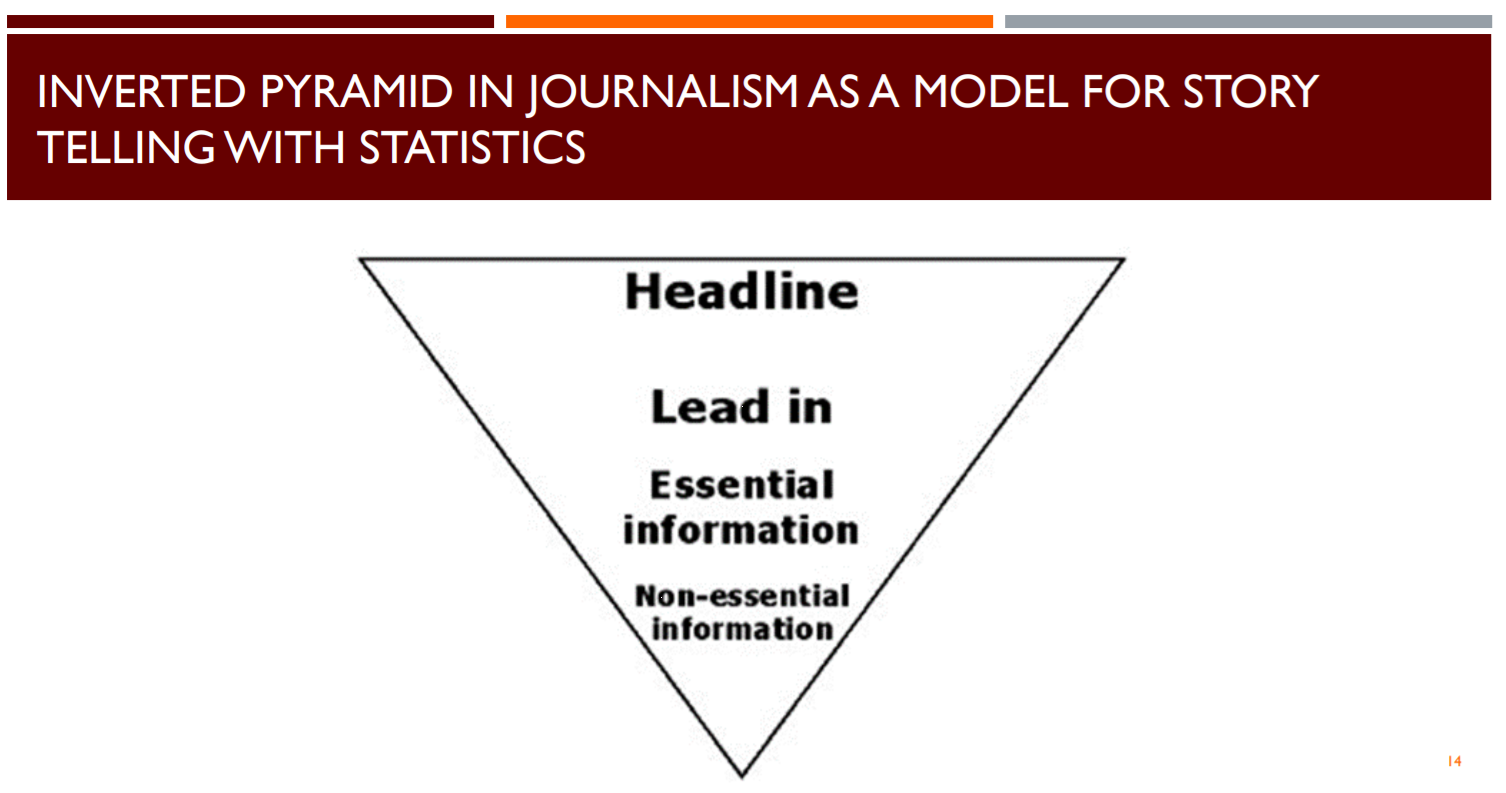
For our purposes, story is not fiction or science fiction, but journalism, and specifically journalism with checked facts. Vab Mullekom recommended applying the below inverted pyramid used in articles as a presentation style. This allows different audiences to digest your analysis at the level they want to.

Van Mullekom says IMRAD (Introduction, Methods, Results, Analysis, Discussion) makes a boring structure for presentations. (I have had a chance to see that hold true many, many times at statistics conferences.) Instead, she recommends a few more interesting structures that engage system 1. An example of one is “Problem, Causes, Solution,” as I’ve somewhat applied here for each talk.
Van Mullekom presented some tools to encourage engagement. To further your story, you can add some “-ization” – as in dramatization, personalization, emotionalization, or fictionalization.
She brought up a few story genres one could couch their presentation in. These included:
- Fairy Tale/Fable/Folk Tale
- Why?
- Quest
- Origin Stories
- Failure Stories
- Behind the Scenes
- Team Stories
A third engagement tool Van Mullekom recommends is making statistics relatable with ADEPT framework:
ADEPT Methodology
- Analogy: Tell me what it’s like.
- Diagram: Help me visualize it.
- Example: Allow me to experience it.
- Plain English: Describe it with everyday language.
- Technical Definition: Discuss the formal details.
Like most soft skills, the ones Van Mullekom discusses all seem to go without saying. On the other hand, I know I could become an even better storyteller, and the presenters at conferences like these very often could as well. It’s harder for me to get their message that they’ve done awesome work when it’s conveyed in an IMRAD presentation. I do wonder, though, if storytelling can become distracting. It can look like it’s covering up content. But when content and storytelling interlace, it is a treat.