Does less sleep today lead to more calories tomorrow?
Introduction
Last few months I’ve gained some weight so I’m curious if analytics can give insight and show opportunities to get my BMI to normal weight. As a first step, an inquiry into a hypothesis about calories vs. sleep.
Bottom line up front
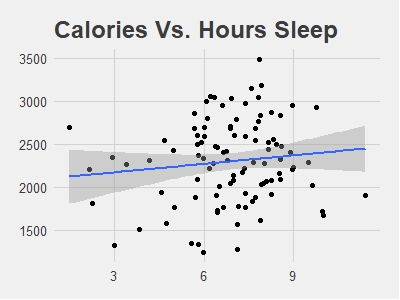
Days I’m running on less sleep do I eat more to make up for it? Fortunately I have Fitbit data. Bottom line up front: I found no association between hours of sleep the night before and calories recorded the next day (p = 0.241 after filtering missing data, and see how a horizontal line would fit within the error ribbon above). In this process I found a possible lever I could use, though. If I can make 2500 calories my future maximum goal, I can monitor an interesting personal KPI: percent of days calories are above 2500. I hope less than 2 a month.
Analysis
Getting data
Fitbit data currently can be downloaded from one’s user account. This is limited to daily-level data and downloads of a month at a time. I recommend the .xls format for easier processing in R.
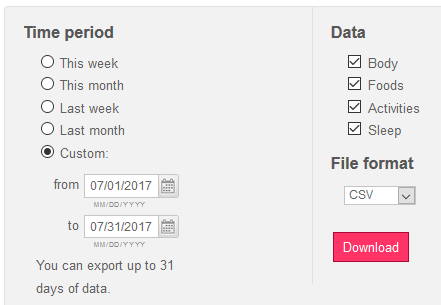
I renamed each file to each month.

So here I’ve got six months of data. Now, my key starting hypothesis is my daily calorie consumption depends on my hours of sleep the night before. In particular, I expect a negative association: the less I slept, the more I ate.
So I’m going to need a handful of packages to efficiently get to this answer and pursue my sub-queries along the way. These packages, to be specific:
require(tidyverse)
require(readxl)
require(lubridate)
require(ggthemes)
require(stringr)
require(purrr)
December data
Once these packages are loaded, I can explore December, my most recent month. Note Calories has a comma, so needs to be converted to a number. Similarly, Date needs to be converted to a date. Fixing that and plotting…
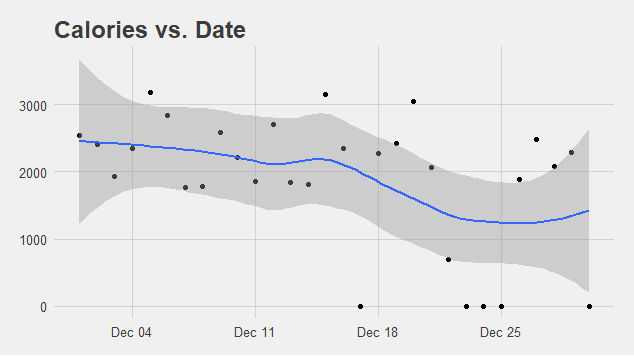
Wow! I’ve really gone on a diet in late December! My self-discipline is awesome!
Oh, wait… I see some zeros. And I know I wasn’t fasting all of those days. In fact, I happen to know I didn’t record calories some days and usually those non-recorded days are above average calorie days, if anything. So I can’t just impute with December’s median or mean. I’d bet 2500 is a fair guess. That might be a charitable gift to myself around Christmas given how many calories I bet I actually consumed…
In fact the day below 1000 calories is also probably fair to set at 2500 too. So let’s fix those and replot.
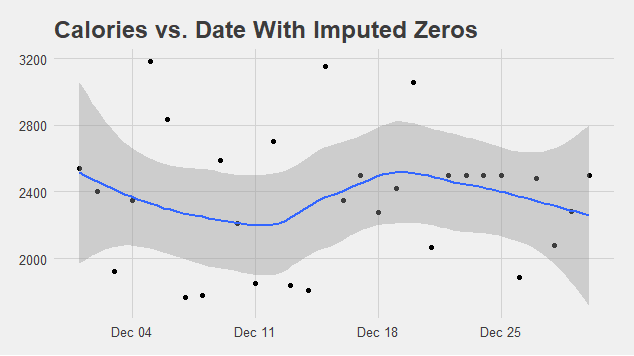
A less impressive decrease in calories. Let’s take a look at a boxplot.
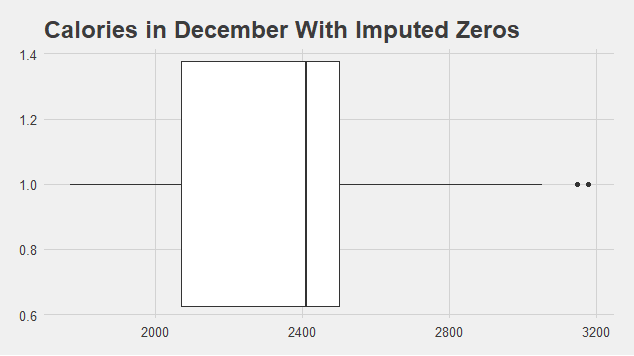
The median’s actually kind of high (gasp!). This range looks believable based on my memory of the month - I mean it’s December. Let’s check out a histogram.
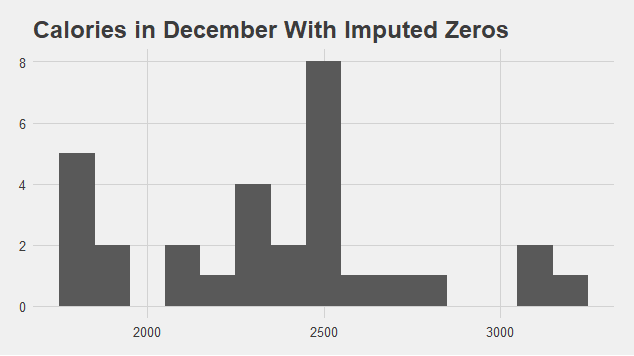
This actually doesn’t look too normally distributed.
Pulling in all six months
To reduce keystrokes, can use map from purrr library to get them all into one data object.
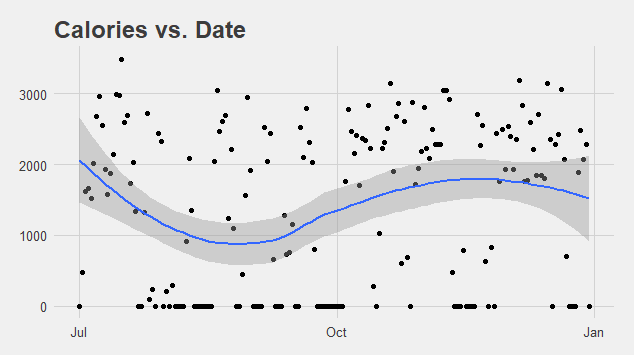
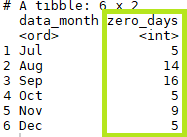
Seem to be a lot of zeros. How many zeros are there?
So we have a little problem here. Apparently in August and September I took a break from counting calories. November doesn’t look that complete either. I think July, August and December we can do something with, but time series analysis is looking less and less plausible.
I’ll take those three more complete months and impute everything 1200 calories or fewer to 2500.
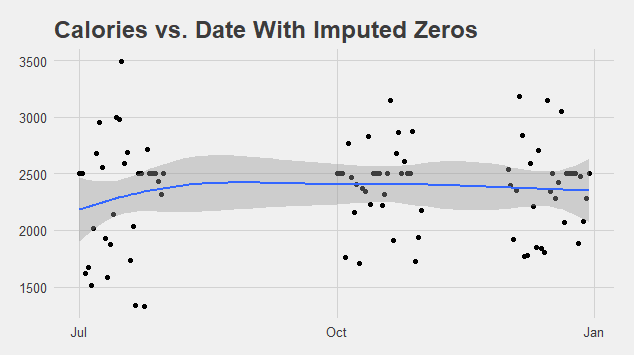
Sigh, less impressive a decrease in calories. Let’s see the boxplot to get a sense of distribution.
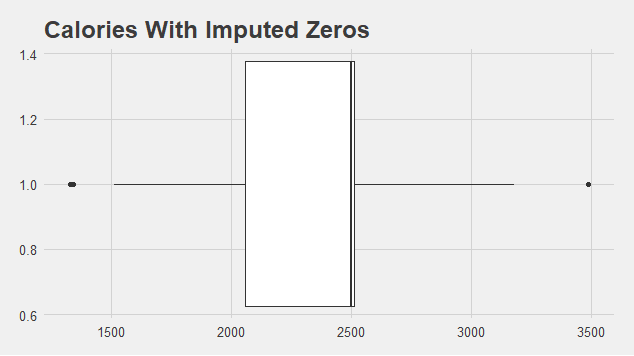
Median’s actually kind of high and quite a bit of bunching near 2500, the imputed value on my missing days. Histogram…
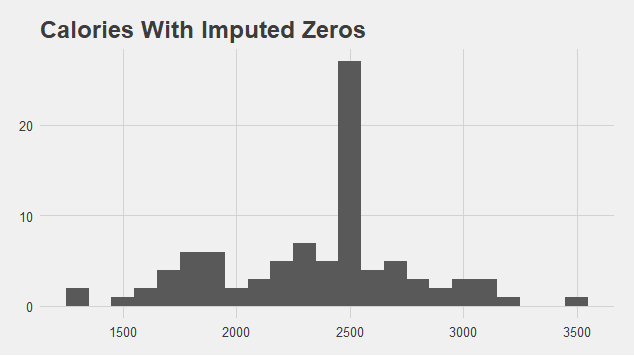
We see a ton at the imputed value. It’s really kind of uniform otherwise. Actually let’s take a closer look at all non-imputed values.
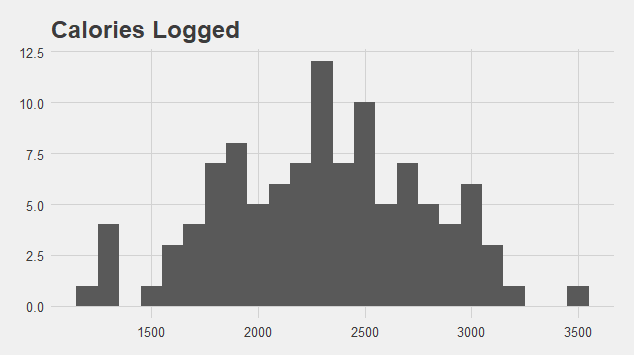
I guess this is why I’ve been gaining weight the last six months, as my doctor has noted. This isn’t really normally distributed but it is actually close to symmetric. Both the median and mean are close to 2300.
In fact it so happens this evening I’m at 2284 right now.
So what is happening on these days above the median?
Original theory goes sleep is a big factor, that a low sleep day is a high calorie day. Let’s see.
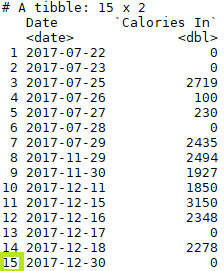
I know there are some zeros for amount of sleep as well. How many? Using anti-join…
Fifteen days. Actually most days here the watch band was broken, as it broke twice. You can tell those by the fact I “didn’t sleep” multiple days in a row. Those are, 7/22 - 7/29 and 12/15-12/18. The other days could be ones I was traveling and so slept sitting up and fitbit didn’t record sleep. And 12/30 hasn’t happened yet.
This tells me December data is also suspect, unfortunately. Let’s just join everything and remove every suspect day as defined as less than 1200 calories and 0 hours of sleep.
foods %>% full_join(sleep_processed, by = "Date") %>%
  filter(`Calories In` > 1200, `Hours Sleep` > 0) ->
  Calories_vs_Sleep
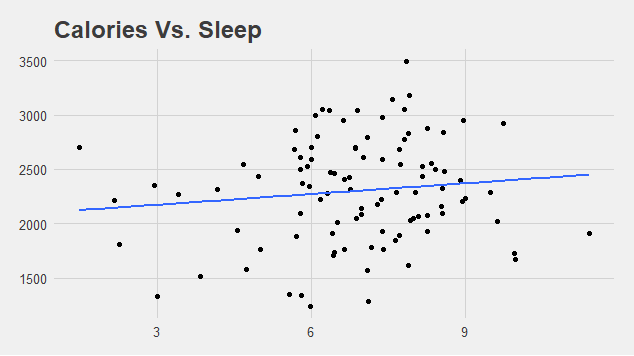
Oh dear, a positive slope. Maybe something shows up if considering day of week.
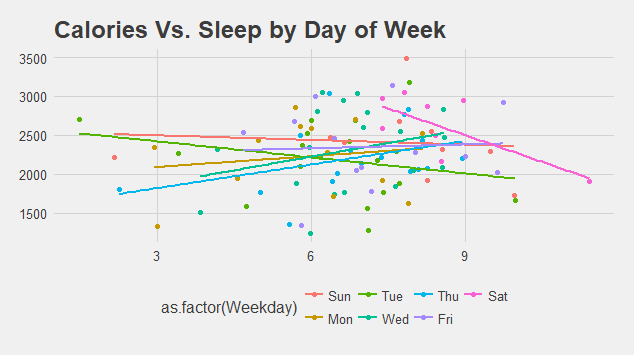
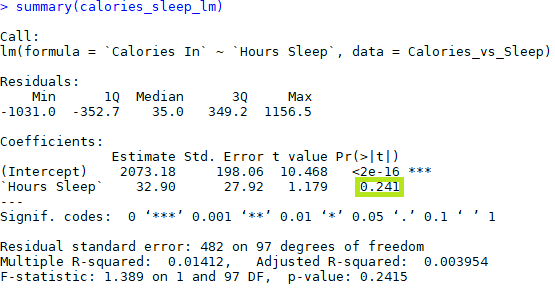
My hypothesis was these would be negative slopes. Are any even significant? We can do an anova or a linear model and see, but this isn’t looking good.
Yeah it’s non-significant.
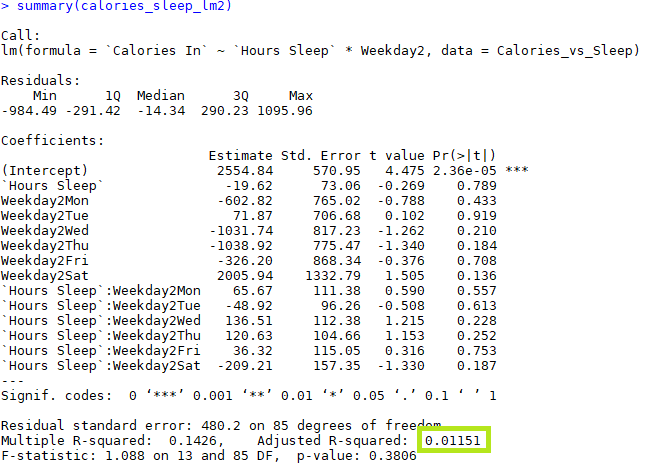
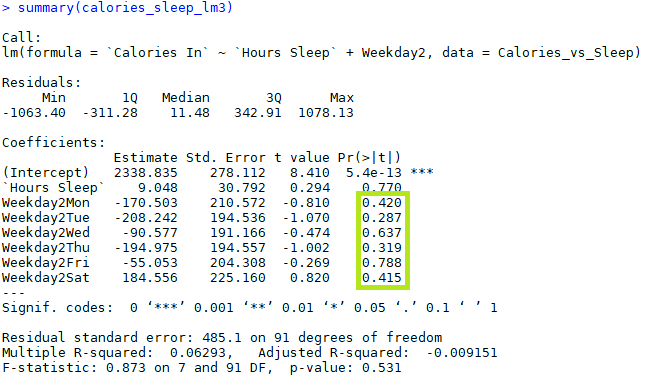
Though I wouldn’t expect anything, let’s just see if there is a day that does show up as significant.
Look at that adjusted R-squared of 0.01! Seriously, there’s no evidence for anything going on. Even removing interaction terms presents nothing - no evidence for a different average calorie total per day of the week.
What have I learned? And what can I do?
I’d hoped more sleep meant fewer next day calories. There’s no good evidence for that in the last six months for me. This does assume these data are reliable, which could be problematic. But I’d hope to see at least something going on. So more sleep won’t save me.
But my take away is the big surprise of the median calories last six months. 2300 is a dang lot, and that’s ignoring the 0’s, which are probably usually higher, so my true median is even higher. That’s why I’ve gained the last six months. I think I need to get the median and average down.
That is where I see a good lever, possibly. The obvious approach would be to try to set some kind of limit like either I stop before 2300, or I have to do more exercise if I pass it, or something like that.
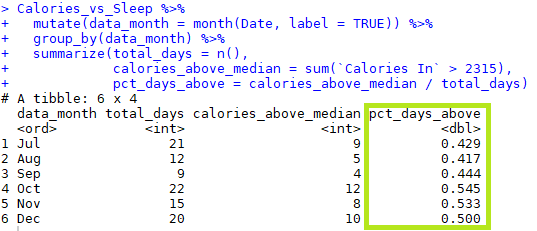
I wonder if above 2300 days are happening more or less frequently recently?
It does look like I’m (recording) going above the median more often recently so maybe a slight upward trend if anything. Makes sense with Holidays and Winter.
How many days did I record more than 2500?
This is astonishing. Nearly 1/3 of the data points I have are days I ate more than 2500. Wow. This is a number I can get. I can work on trying to reduce those days to two or fewer times a month. I just don’t need that much, ever, especially when wanting to lose weight. Basically, I have a KPI I care about. A metric that drives as Gwendolyn Galsworth would say. That KPI is percent of days over 2500 calories. I want to get that number to 0% or at most 2 out of 30 days is 7%. Pretty cool.
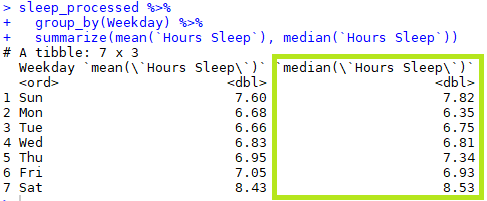
And finally, since we’re looking at sleep, how does average sleep per day look?
Monday’s the tough one. Saturday’s the good one. All of these were 9, I wish. Or at least 8. A future KPI I think.
Analysis next steps
So what makes a lower calorie day different than a higher calorie day? That is the regression I want to know the answer to.
Feature engineering to follow for a future analysis.
R code used above
require(tidyverse)
require(readxl)
require(lubridate)
require(ggthemes)
require(stringr)
require(purrr)


December_foods <- read_excel(
  path = "fitbit_export_201712.xls",
  sheet = "Foods")

# doesn't see Calories as a number
glimpse(December_foods)
# both are characters
December_foods$Date <- ymd(December_foods$Date)
December_foods$`Calories In` <-
  as.numeric(gsub(",", "", December_foods$`Calories In`))

ggplot(December_foods, aes(x = Date, y = `Calories In`)) +
  geom_point() +
  geom_smooth() +
  theme_fivethirtyeight() +
  labs(title = "Calories vs. Date")


assumed_calories_on_blank_days <- 2500
December_foods$`Calories In`[December_foods$`Calories In` <= 1000] <-
  assumed_calories_on_blank_days

ggplot(December_foods, aes(x = Date, y = `Calories In`)) +
  geom_point() +
  geom_smooth() +
  theme_fivethirtyeight() +
  labs(title = "Calories vs. Date With Imputed Zeros")


ggplot(December_foods, aes(x = 1, y = `Calories In`)) +
  geom_boxplot() +
  theme_fivethirtyeight() +
  labs(title = "Calories in December With Imputed Zeros") +
  coord_flip()


ggplot(December_foods, aes(x = `Calories In`)) +
  geom_histogram(binwidth = 100) +
  theme_fivethirtyeight() +
  labs(title = "Calories in December With Imputed Zeros")


### Let's pull in all six months now
7:12 %>% as.character() %>% str_pad(2, pad = "0") -> data_months
files_to_load <- paste0("fitbit_export_2017"
                        , data_months, ".xls")
glimpse(files_to_load)

foods <- map(files_to_load, read_excel, sheet = "Foods")

glimpse(foods)
# we have a list of 6 tables, let's combine them all

foods <- bind_rows(foods)
glimpse(foods)

# OK have to process same as before
foods$Date <- ymd(foods$Date)
foods$`Calories In` <-
  as.numeric(gsub(",", "", foods$`Calories In`))

# how many zero days are there this time?
ggplot(foods, aes(x = Date, y = `Calories In`)) +
  geom_point() +
  geom_smooth() +
  theme_fivethirtyeight() +
  labs(title = "Calories vs. Date")


foods %>%
  mutate(data_month = month(Date, label = TRUE)) %>%
  group_by(data_month) %>%
  summarize(zero_days = sum(`Calories In` == 0))


foods %>%
  mutate(data_month = month(Date, label = TRUE)) %>%
  filter(data_month %in% c("Jul", "Oct", "Dec")) ->
  foods_full_months

assumed_calories_on_blank_days <- 2500
foods_full_months$`Calories In`[foods_full_months$`Calories In` <= 1000] <-
  assumed_calories_on_blank_days

# replot
ggplot(foods_full_months, aes(x = Date, y = `Calories In`)) +
  geom_point() +
  geom_smooth() +
  theme_fivethirtyeight() +
  labs(title = "Calories vs. Date With Imputed Zeros")


ggplot(foods_full_months, aes(x = 1, y = `Calories In`)) +
  geom_boxplot() +
  theme_fivethirtyeight() +
  labs(title = "Calories With Imputed Zeros") +
  coord_flip()


ggplot(foods_full_months, aes(x = `Calories In`)) +
  geom_histogram(binwidth = 100) +
  theme_fivethirtyeight() +
  labs(title = "Calories With Imputed Zeros")


foods %>% filter(`Calories In` >= 1200) %>%
  ggplot(aes(x = `Calories In`)) +
  geom_histogram(binwidth = 100) +
  theme_fivethirtyeight() +
  labs(title = "Calories Logged")


### So what is happening on these days I eat above the median?

sleep <- map(files_to_load, read_excel, sheet = "Sleep")

sleep <- bind_rows(sleep)
glimpse(sleep)

# some processing

sleep %>% mutate(Date = as.Date(ymd_hm(`End Time`)),
                 Minutes_Asleep = as.numeric(`Minutes Asleep`)) %>%
  group_by(Date) %>%
  summarize(`Hours Sleep` = sum(Minutes_Asleep) / 60 ) %>%
  mutate(Weekday = wday(Date, label = TRUE),
         Weekday2 = factor(Weekday, ordered = FALSE)) ->
  sleep_processed

glimpse(sleep_processed)

anti_join(foods, sleep_processed, by = c("Date", "Date"))


foods %>% full_join(sleep_processed, by = "Date") %>%
  filter(`Calories In` > 1200, `Hours Sleep` > 0) ->
  Calories_vs_Sleep

# drumroll
Calories_vs_Sleep %>% ggplot(aes(x = `Hours Sleep`,
                                 y = `Calories In`)) +
  geom_point() +
  geom_smooth(se = FALSE, method = "lm") +
  theme_fivethirtyeight() +
  labs(title = "Calories Vs. Sleep")


Calories_vs_Sleep %>% ggplot(aes(x = `Hours Sleep`,
                                 y = `Calories In`,
                                 col = as.factor(Weekday))) +
  geom_point() +
  geom_smooth(se = FALSE, method = "lm") +
  theme_fivethirtyeight() +
  labs(title = "Calories Vs. Sleep by Day of Week")

calories_sleep_lm <- lm(`Calories In` ~ `Hours Sleep`,
                        data = Calories_vs_Sleep)
summary(calories_sleep_lm)

calories_sleep_lm2 <- lm(`Calories In` ~ `Hours Sleep`*Weekday,
                        data = Calories_vs_Sleep)
summary(calories_sleep_lm2)
# which is Weekday.Q?
# it's quadratic, instead I just the day itself
calories_sleep_lm2 <- lm(`Calories In` ~ `Hours Sleep`*Weekday2,
                         data = Calories_vs_Sleep)
summary(calories_sleep_lm2)
# there's no evidence for anything going on

# just want to check without the interaction terms
calories_sleep_lm3 <- lm(`Calories In` ~ `Hours Sleep` + Weekday2,
                         data = Calories_vs_Sleep)
summary(calories_sleep_lm3)
# there isn't even evidence for a different calorie level per day on average


### What have I learned? ----
# There's room for further questions.
# For example, another possibility is to look at the day before,
# That is, does more food mean less sleep the next day?
# Could also consider last two days sleep vs. calories
# Going into the details of what I ate after less sleep could also
# be interesting - maybe TF/IDF - like idea
# may not have enough data
# sleep vs. exercise would be interesting


Calories_vs_Sleep %>%
  mutate(data_month = month(Date, label = TRUE)) %>%
  group_by(data_month) %>%
  summarize(total_days = n(),
            calories_above_median = sum(`Calories In` > 2315),
            pct_days_above = calories_above_median / total_days)


# another good question would be to consider data from last summer when
# I was losing weight
# how does it look then?
# I also wasn't working full time, so may be different then
# with sleep connection

Calories_vs_Sleep %>%
  mutate(data_month = month(Date, label = TRUE)) %>%
  group_by(data_month) %>%
  summarize(total_days = n(),
            calories_above_2500 = sum(`Calories In` > 2500),
            pct_days_above = calories_above_2500 / total_days)


# also cool would be a bagplot of this, but maybe
# if there was a relationship between the two

# some other next steps:
# build up other variables per day like:
#  step count
#  minutes very/fairly active
#  activity calories
#  daily totals of fat, fiber, carbs, sodium, protein
#  day before information
# then run a multiple regression
# maybe some regularization
# maybe include more data
# maybe a month variable (if not too many already)
# maybe a weekend/weekday variable
# maybe a breakfast variable
# dinner vs. sleep?
# exercise vs. sleep?
# previous day's calories vs. sleep? # this could be the real story


# average sleep per day
sleep_processed %>%
  group_by(Weekday) %>%
  summarize(mean(`Hours Sleep`), median(`Hours Sleep`))
