
ASA Conference on Statistical Practice 2018, Saturday 1 of 4, Poster Session 3 / Survival Analysis v. 'Survival' Analysis
Highlights from Conference on Statistical Practice
Friday 2/16/2018
- 8:00 AM Keynote Address & 9:15 AM Working with Messy Data
- 11:00 AM Streamlining Your Work Using (Shiny) Apps
- 2:00 PM Data Mining Algorithms / Presenting and Storytelling
- 3:45 PM Working with Health Care Data
- Posters I Wish I’d Seen
- Additional Sessions I Wish I’d Attended
Saturday 2/17/2018
- 9:15 AM Poster Session 3 / Survival Analysis v. ‘Survival’ Analysis
- 11:00 AM Causal Inference
- 2:00 PM Deploying Quantitative Models as ‘Visuals’ in Popular Data Visualization Platforms
- Additional Sessions I Wish I’d Attended
9:15 AM Poster Session 3 / Survival Analysis v. ‘Survival’ Analysis
Exploring Data Quality and Time Series Event Detection in 2016 US Presidential Election Polls, Kaelyn M. Rosenburg, Reed College
Problem: Polling implied Clinton would beat Trump. Could survey mode effect explain this error?

This cool plot shows how web vs. phone polling converged for Clinton over time but Trump’s web polling consistently remained higher than phone polling. She suggests this visualizes a possible social desirability bias that could have led to variability in polling estimates.
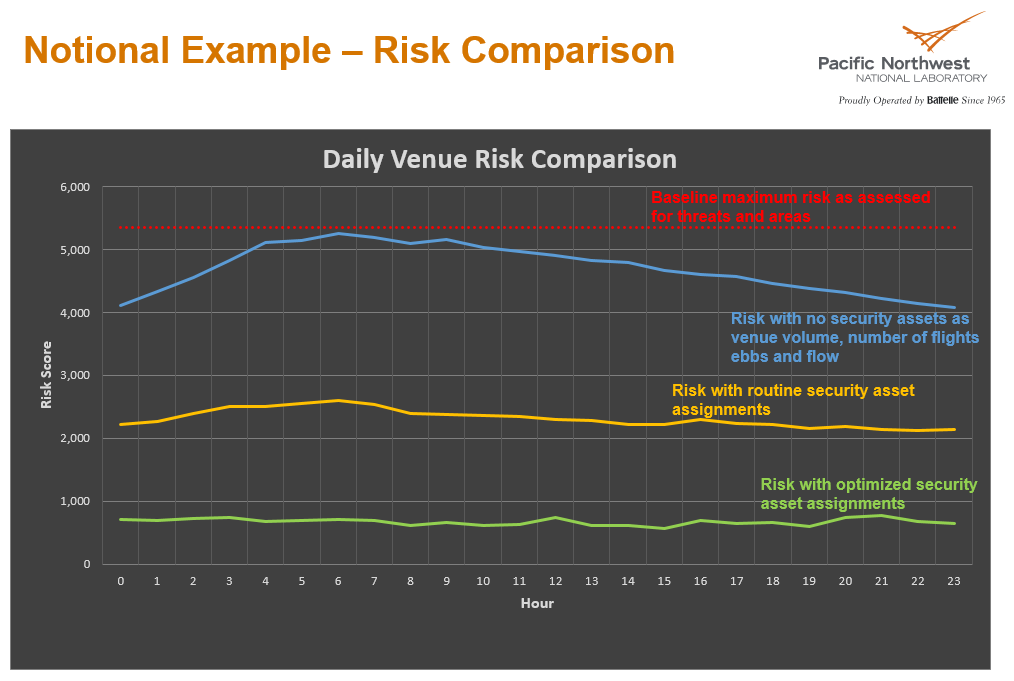
Statistical Methods for National Security Risk Quantification and Optimal Resource Allocation, Robert Brigantic and Nick Betzsold, Pacific Northwest National Laboratory
Problem: given multiple risk points and danger situations, how do we best allocate resources to reduce risk? Can we do this intelligently based on data and logic, to supplement expert intuition?
Pacific Northwest National Lab attempted to solve this problem by quantifying risk. They break it down into quantifiable sub-problems. The final equation, I thought was a nice way to represent it: R = f(C,V,T). This means risk is a function of Consequence, Vulnerability, and Threat. Consequence means how severe is an event - especially in terms of death or injury. Vulnerability means how easy to exploit is a given location? And Threat means likelihood of natural or man-made occurrence with potential to harm life, information, or property.
Breaking risk down into these three components allows further breaking it down into measurable sub-components, until it’s at a level that analysis can be done. Here they have taken the first component, C, Consequence, broken it down into seven categories, broken a site down into five areas, looked at three possible scenarios and calculated the consequence level of that type of event occurring in that area on that category of consequence on a scale of 1 to 5. The numerical estimate comes with help from data and stakeholders.

I think this systematic approach could be used to model risk in other questions, such as risk of a hospital admission, or risk of diabetes worsening to other conditions such as end stage renal disease. Instead of five areas, each member of a population would be an “area”. Each “security threat” would be a condition that a member could obtain, such as renal disease or cardiovascular disease. Consequence could be separated into the quadruple aim, vulnerability could come from chronic conditions. Threat would be the likelihood of each one, perhaps based on data.
up next : 11:00 AM Causal Inference